Company background
Established in 1970, Aspial Corporation Ltd started off its business as a traditional jeweller under a stable of household brand names including Aspial, Lee Hwa Jewellery, Goldheart and Citigems. The company has since diversified into other businesses including property development and financial services, with the latter mainly operated through SGX-listed Maxi-Cash Financial Services Corporation Ltd (“Maxi-Cash”). Aspial reports three business segments namely Jewellery, Financial Service, and Real Estate.
The founding Koh family controls more than 80% of Aspial’s shares. Mr Koh Wee Seng leads the company as CEO since 1994. His sister Ms Ko Lee Meng sits on the board of directors as a non-executive and non-independent director.
Aspial’s management teams in charge of the different business segments are headed by the Koh family members. Mr Ng Sheng Tiong, brother-in-law of Mr Koh Wee Seng, is the CEO of Aspial’s property arm World Class Global Limited (“WCG”). His wife Ms Koh Lee Hwee also sits on WCG’s board as a non-executive director.
The group’s financial policy has clearly gravitated toward more aggressiveness since it first diversified into the property development field some twenty years back in 2001. We took some comfort that a number of Aspial’s insiders hold meaningful stakes in Aspial’s shares and debt securities, valued at a significant amount relative to their annual compensation (see Table 1). However, we noted that on 6 Jan 20, Aspial disclosed that Mdm Ko Lee Meng and Ms Koh Lee Hwee sold an aggregate principal amount of S$1.50m and S$0.25m of the ASPSP 5.300% 01Apr2020 Corp (SGD) - Retail, for a purchase price of S$1.525m and S$0.254m respectively, back to the company.
Table 1: Director’s interests (as at 31 Dec 18)
|
Name |
Position/relation |
Aggregate value of term notes and bonds held (S$’000) |
Remuneration band |
|
Mr Koh Wee Seng |
Group CEO |
18,724 |
S$1.25m to S$1.50m |
|
Mdm Koh Lee Hwee |
Executive Director |
4,150 |
S$1.25m to S$1.50m |
|
Mdm Ko Lee Meng |
Non-Executive and Non-Independent Director |
9,097 |
N.A. |
|
Mdm Ng Bie Tjin @ Djuniarti Intan |
Independent Non-executive Director |
1,000 |
Below S$0.25m |
|
Source: Company |
|||
Drying development pipeline
In 2019, Aspial had been mostly focusing on the development and marketing of Australia 108. Launched in 4Q14, Australia 108 is a residential project with 1,103 luxury apartment units, touted to be Melbourne’s tallest residential building with 101 floors. As at 7 Nov 19, Aspial completed 91% of the development, with construction of the skyscraper having progressed to level 97 out of a total of 101 levels.
Other than Australia 108, the group will continue to sell the remaining units at Nova City Tower 1. Launched in 4Q16, Nova City Tower 1 is a residential and commercial mixed-use development project with a total of 187 residential units. As at 31 Mar 19, 101 units were launched and 40% of these were sold. Strangely, the sales figure was lower than the 61% reported as at 4Q18, possibly indicating that buyers had been cancelling their purchases.
In Singapore, Aspial will continue to sell the remaining commercial units at CityGate, a mixed development project jointly developed with Fragrance Group Limited that has obtained temporary occupation permit in December 2018. As at 31 Dec 18, Aspial had S$76.1m (3Q19: S$65.2m) of properties held for sale, which included 3,677 square metres of spaces at CityGate.
Aspial operates seven hotels comprising 121 rooms with a total of 72 keys in Penang, Malaysia. Aspial expects its hotel portfolio in Penang to increase to about 350 keys by the end of 2020. While this could potentially provide more recurring income, we note that rental income represented just about 4.7% (9M18: 3.2%) of Aspial’s profit before tax in 9M19.
Save for the hotel expansion in Penang, Aspial’s growth pipeline for its real estate business looks dry to us. As shared in its 2018 annual report, Aspial intended to launch a 92-storey development project in Brisbane, Australia, in 2020, although we think this may do little to improve the company's financial health.
Jewellery and financial service businesses
In 9M19, Aspial’s jewellery business recorded S$99.1m of revenue, up slightly from S$98.1m in 9M18 thanks to sales from overseas operations (likely under the Niessing brand, a German jeweller), which helped to offset lower sales from Singapore outlets. Aspial further reduced operating costs for its retail operations in Singapore, and recorded higher share of profits from associates. As a result, pre-tax losses from Aspial’s jewellery division narrowed to S$2.4m (9M18: pre-tax loss of S$2.8m).
Meanwhile, revenue from the pawnbroking business decreased by 2.9% YoY to S$157.1m in 9M19. According to Aspial, the segment’s revenue softened mainly due to lower sales from retail and trading of jewellery and branded merchandise, partially offset by higher revenue from the pawnbroking and secured lending operations. Notwithstanding the fall in revenue, pre-tax profit for the segment increased 40.0% YoY to S$13.3m over the same period.
Significant refinancing wall
Aspial’s total debt remained heavy at S$995.8m as of 30 Sep 19, despite falling from S$1.2 billion in 4Q18 following the redemption of notes due in June and open market purchases of existing bonds. Cash and bank balances narrowed to S$30.8m as at 3Q19 (4Q18: S$59.0m). Net gearing consequently fell to 2.3x from 2.7x over the same period, which was still an elevated level in our opinion.
In the nine months to September, Aspial generated S$80.1m (9M18: S$171.4m) of cash from operating activities (“CFO”) which we think likely came from the progressive handover of units at Australia 108. Meanwhile, it also generated S$71.7m of cash from investing activities, mainly comprised of S$67.4m of proceeds from the disposal of investment securities. These cash inflows were, however, insufficient to cover S$179.7m of cash outflow in financing activities, mainly for debt repayment.
Aspial’s interest coverage ratio (EBIT over interest) has declined steadily over the years, standing at 2.5x in 9M19, down from 3.6x in 9M18 (2012: 6.9x). The most recent interest coverage indicated a modest capacity to service debt obligations, and we think Aspial’s interest cover is unlikely to improve quickly given the falling sales rate at Australia 108.
Aspial’s financial liquidity looks tight with S$745.7m of debt to be repaid within twelve months following September, a vast sum relative to just S$30.8m of cash and bank balances on hand. Aspial’s refinancing wall is worryingly high even if we exclude the S$258.7m of short-term debt of Maxi-Cash, or optimistically assuming that it can roll over S$381.8m of secured short-term debt. To pare down debt, Aspial will likely have to rely on proceeds to be collected from the sale of units at Australia 108 or external financing.
In a response to SGX for queries on its 9M19 financial results, Aspial shared that it expects to realise cash proceeds of about AUD400m (~S$372m) from the settlement and handover of units for Australia 108 in the next twelve months. To reiterate, we think it is critical for Aspial to realise a substantial amount of cash proceeds from the Australia 108 project to repay the ASPSP retail bonds maturing in 2020, comprising of the S$190m ASPSP 5.300% 01Apr2020 Corp (SGD) - Retail and S$150m ASPSP 5.250% 28Aug2020 Corp (SGD) - Retail.
As at 1Q19, 88% of units were sold at Australia 108. This figure had fallen from a high of 98% reported from a year ago in 1Q18, suggesting that buyers had been walking away from their purchase agreements. We observed that Aspial had not disclosed sales progress of its projects in 2Q19 and 3Q19, which raised our concerns that the number of units sold at Australia 108 might have continued to drop.
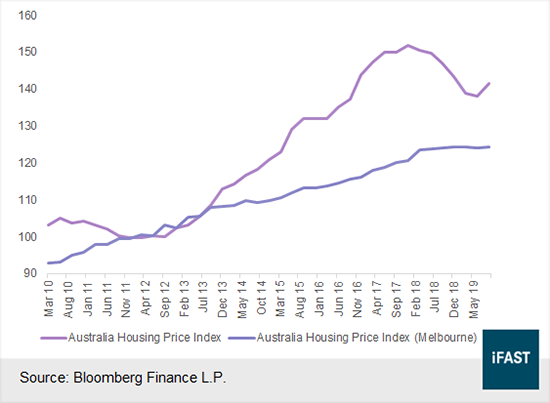
Arguably, this could also mean that Aspial could sell units of cancelled purchases at higher prices, given the steady housing market in Melbourne (see Figure 1) and that sales of subsequent phases of the Australia 108 project carried higher average sales price per square metre. However, we think the decrease in sales is overall credit negative as it exacerbates Aspial’s liquidity risk. The company may also be compelled to offload units at steep discounts in view of its liquidity constraints.
Figure 1: Australia’s housing price indices from 2010 to 2019
Apart from sales proceeds from the settlement of Australia 108 units, Aspial also shared that it intends to repay the S$190m ASPSP 5.3% 20s via external financing, which may include secured bank loans. As of end-September, Aspial had S$104.9m of property, plant and equipment (consisted of mostly freehold and leasehold properties), S$74.8m of investment properties, S$154.7m of inventories (mostly jewelleries), S$540.0m of development properties and S$65.2m of properties held for sale.
With total secured debt of S$489.9m, we think there is room for Aspial to pledge assets for additional debt to repay the ASPSP 5.3% ‘20s. However, existing loan covenants may be a potential hindrance to the company’s raising additional secured debt. The group’s existing loans include financial covenants that require it to maintain aggregate outstanding debt secured against the properties not exceeding 50-80% of the value of the relevant development properties at all times. Last but not least, debt maturities subsequent to the ASPSP 5.3% ‘20s may continue to post significant challenges.
Aggressive leverage remained as a concern
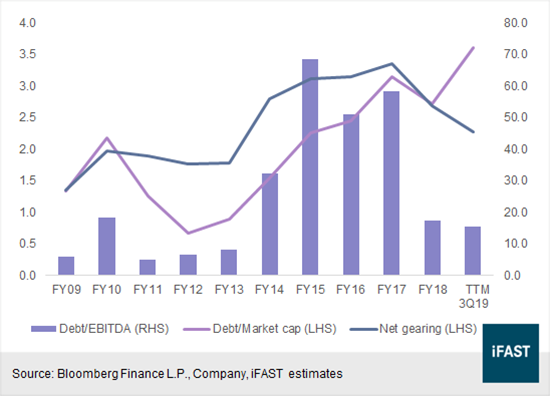
Aspial’s balance sheet appears stretched by any standards. Besides a high net gearing of 2.3x, the group’s debt-to-EBITDA (trailing twelve months, “TTM”) and debt-to-market capitalisation ratios are also elevated at 15.5x and 3.6x respectively as of 3Q19. Its debt burden exceeds its market cap significantly and the gap does not seem likely to narrow anytime soon (see Figure 2).
Figure 2: Aspial’s total debt vs market cap
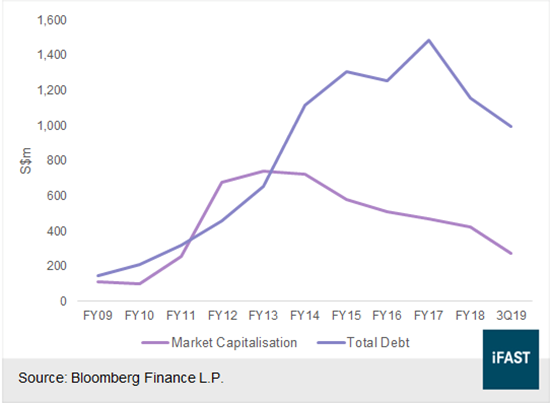
As seen in Figure 3, Aspial’s credit health deteriorated markedly between 2015 and 2017, with a record high S$1.5 billion of debt load in 2017. Credit metrics subsequently improved in 2018 and 9M19, but still indicated an elevated level of indebtedness. Particularly, while the debt-to-TTM EBITDA ratio improved from 17.4x in 2018 to 15.5x in 3Q19, Aspial’s debt over market cap moved in the opposite direction and climbed from 2.7x to 3.6x over the same period.
Figure 3: Aspial’s credit metrics from 2009 to 3Q19
Additionally, Aspial’s debt-to-asset ratio averaged at an elevated level of about 0.7x over the past five years (3Q19: 0.7x). Excluding S$9.5m of intangible assets and S$365.3m of trade and other receivables (mainly loan receivables held at Maxi-Cash), we find the adjusted debt-to-asset ratio at 0.8x as at 3Q19.
We also observe that Aspial’s business has not been generating positive CFO most of the time (see Figure 4). Most of the negative operating cash flows incurred between 2012 and 2017 were due to large increases in development properties, signalling a long development life cycle from launching to settlement.
Figure 4: Aspial’s CFO from 2009 to TTM 3Q19
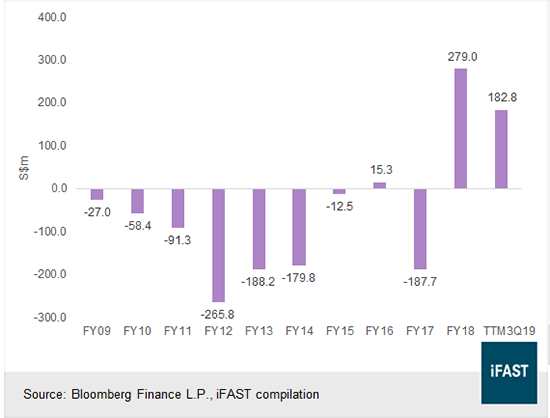
While Aspial’s CFO swung to positive S$279.0m in 2018, it had fallen to S$182.8m in TTM 3Q19 primarily due to a smaller decrease in development properties recorded in 9M19. CFO may shrink further if the cancellation rate at Australia 108 increases moving forward.
Aspial’s cash burn was highest in 2012 when it was extensively expanding its property development business, and CFO only practically turned positive after six years, except for a mere S$15m in 2016. During the period, projects completed included AVANT, 8 Bassein, The Hillford and Waterfront@Faber.
We think there may be a mismatch between Aspial’s project development cycles and its debt maturities. For example, Australia 108 was launched in 4Q14 and expected to complete in 2020, while the company’s weighted average debt maturity was about 3 years as at 4Q14.
Another factor that we think might have contributed to negative CFO over the years were cash used in Aspial’s other segments. Nonetheless, we observed that CFO was mostly in the negative territory in the ten years prior to 2012, when, as we believe, Aspial was more of a Jeweller than a property developer. Maxi-Cash (incorporated in 2008) also recorded negative TTM CFO from 2009 to 3Q19, except for 2018.
On the positive side of things, Aspial can potentially
monetize S$74.8m of investment properties (mostly commercial properties in
Penang). Aspial also has ~65% stake in Maxi-Cash worth ~S$92.2m, but given its
controlling shareholder position and the lacklustre share price performance of
Maxi-Cash in recent years, a disposal might have to be at hefty discounts to
the market price. In any case, judging from Aspial’s track record, we think investors
should not lean too much on potential asset monetisation to provide substantial
relief to Aspial’s overleveraged balance sheet.
Future projects are likely to depend on debt financing
As at 30 Sep 19, Aspial had S$540.0m of development properties (most likely pertaining to Australia 108), which together with the company’s cash holdings were insufficient to cover S$745.7m of short-term debt. With another S$250.1m of long-term borrowings lining up to be repaid or refinanced, it is imperative for Aspial to generate cash flows to service debt obligations moving forward.
As mentioned earlier, Aspial intended to launch a 92-storey skyscraper in Brisbane in 2020 if market conditions allow. The project may put more pressure on the company’s financials, and Aspial has shown a tendency to undertake ambitious projects relative to its financial means. The 101-storey Australia 108 project reportedly cost AUD900m to build1, when in 2015 (the year that project development commenced) Aspial’s total assets, total equity and market capitalisation were S$1.7 billion, S$376.3m and S$576.9m respectively. Aspial’s stretched balance sheet suggested that it has little financial headroom to support another massive project without the help of debt financing, which may dampen its already worrying credit profile.
Peer comparison
As shown in Table 2, Aspial appears to have a higher credit risk, as measured by various credit ratios, than other small-to-mid cap property developers in the SGD credit space. While Aspial’s credit metrics seem to be comparable to those of Oxley Holdings Limited, we note that Oxley is deleveraging its balance sheet with ongoing asset monetisation. Oxley also has a bigger operating scale with S$3.6 billion of unbilled sales (as at 6 Jan 20). In contrast, Aspial sees significant business concentration risk with its survival possibly tied to Australia 108.
Table 2: Aspial is highly levered relative to its peers
|
Company |
Net gearing (x) |
Debt over market cap (x) |
Debt over assets (x) |
Current ratio (x) |
|
Aspial Corporation Ltd |
2.3 |
3.6 |
0.7 |
1.5 |
|
Oxley Holdings Ltd |
2.3 |
2.7 |
0.6 |
1.5 |
|
Fragrance Group Ltd |
1.1 |
1.6 |
0.5 |
2.1 |
|
Chip Eng Seng Corporation Ltd |
1.8 |
4.6 |
0.6 |
8.8 |
|
Tuan Sing Holdings Ltd |
1.4 |
4.0 |
0.6 |
0.7 |
|
Perennial Real Estate Holdings Ltd |
0.8 |
3.3 |
0.4 |
1.0 |
|
GSH Corporation Ltd |
0.7 |
0.6 |
0.4 |
2.3 |
|
Note: financial data as at 30 Sep 19 Source: Bloomberg Finance L.P., company filings, iFAST estimates |
||||
Bond recommendations
In summary, our pessimism on Aspial’s credit outlook is centred on its significant refinancing risk, uncertainties surrounding the sales progress and settlement at Australia 108, and an elevated net gearing. As such, we are negative on the company’s credit outlook and bonds (see Table 3).
Table 3: The Aspial bonds
|
Issues |
Ask YTM (%) |
Ask Price |
Z-spread (bps) |
Seniority |
Opinion |
|
3.36 |
100.36 |
189 |
Senior Unsecured |
Underweight |
|
|
6.99 |
99.05 |
554 |
Senior Unsecured |
Underweight |
|
|
8.81 |
96.63 |
748 |
Senior Unsecured |
Underweight |
|
|
9.04 |
95.62 |
726 |
Senior Unsecured |
Underweight |
|
|
*: based on exchange pricing Source: Bloomberg Finance L.P., iFAST compilation |
|||||
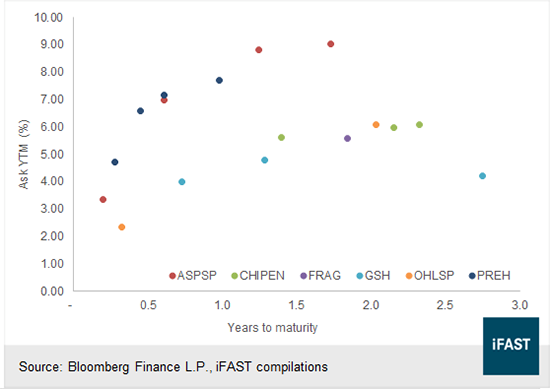
Aspial’s nearest dated S$190m ASPSP 5.300% 01Apr2020 Corp (SGD) - Retail is indicated at an ask yield to maturity (“YTM”) of 3.36% (Z-spread: 189bps). While the bond may seem to offer 103bps more than Oxley’s OHLSP 5.15% ’20s (ask YTM: 2.33%; Z-spread: 86bps), we wish to highlight that in contrast to Aspial, we think Oxley has largely resolved its refinancing wall.
The ASPSP 5.250% 28Aug2020 Corp (SGD) - Retail carries an ask YTM of 6.99% (Z-spread: 554bps), representing a substantial yield pick-up of 363bps over the ASPSP 5.3%’20s. The substantial yield pick-up despite just a five-month difference between their maturity dates suggested that the market is pricing in much higher risk on Aspial’s longer dated bonds. We agree with the market’s assessment, as bonds maturing after the ASPSP 5.3% ’20s may continue to post significant challenges to Aspial. As such, we are bearish on the ASPSP 5.250% 28Aug2020 Corp (SGD) - Retail in spite of its sizeable yield pick-up over the ASPSP 5.3% ’20s.
The ASPSP 6.250% 11Oct2021 Corp (SGD) carries an ask YTM of 9.04% (Z-spread: 726bps), 23bps higher than the ASPSP 5.900% 19Apr2021 Corp (SGD) and representing a decent compensation for the duration risk. However, the indicative pricings may be poorly reflective of actual market prices as both bonds have a small issue size of S$50m, with a meaningful amount held by insiders.
As seen in Figure 5, Aspial’s 2021 bonds offer some of the highest yields among peer credits. However, our recommendation for the two ASPSP 2021 notes is still underweight given the issuer’s weak credit fundamentals. The ask YTMs of 8.81% and 9.04% respectively offer insufficient compensation in our view for Aspial’s significantly higher credit risk.
As a reference, the $120m PREHSP 3.900% 12Jan2021 Corp (SGD) with its ask YTM of 7.69% (Z-spread: 742bps) represents a good alternative for high-yield seekers given its healthier credit profile relative to Aspial. As shown in Table 2 above, Perennial has a much lower net gearing than Aspial. Furthermore, the company has indicated the intention to sell its 31.2% interest in AXA Tower, which should fetch a good price given the buoyant office market in Singapore.
Figure 5: Relative valuation
References
1 Australia 108 Sub-Penthouses. 11 May 2015. Retrieved from https://www.apartmentdevelopments.com.au/buying-living/market-insights/australia-108-sub-penthouses.
Declaration:
For specific disclosure, at the time of publication of this report, IFPL (via its connected and associated entities) has a principal position in OHLSP 6.375% 21Apr2021 Corp (USD) and PREHSP 4.550% 29Apr2020 Corp (SGD) - Retail. The analyst who produced this report holds a NIL position in the abovementioned securities.